实现Adaboost

题目要求如下:

2018-11-14 19-34-48屏幕截图.png

2018-11-14 19-35-55屏幕截图.png

S,M,L这些字母太过抽象,这里让S=1,M=2,L=3。

首先产生数据:

1
2
3
4
5
6
7
8
9
import numpy as np
import matplotlib.pyplot as plt


def GetDataset():
x1 = np.array([1,1,1,1,1,2,2,2,2,2,3])
x2 = np.array([1,2,2,1,1,1,2,2,3,3,3])
y = np.array([-1,-1,1,1,-1,-1,-1,1,1,1,1])
return x1,x2,y

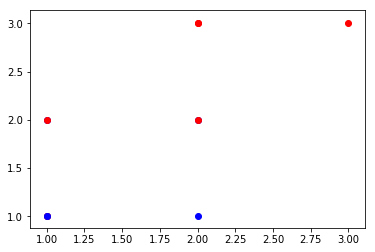
画出原始散点图如下:

1
2
3
4
5
6
7
8
9
x1,x2,y = GetDataset()
plt.figure()
for i in range(11):
if y[i]<0:
plt.scatter(x1[i],x2[i],c='b')
else:
plt.scatter(x1[i],x2[i],c='r')

plt.show()

output_8_0.png

然后是设计基学习器,这里根据基学习器处理数据维度的不同,以及大于或者小于的不同,将数据标签分成1或者-1,代码如下:

1
2
3
4
5
6
7
8
9
10
11
12
def BaseLearn(dim,threshnum,low_or_high):
x1,x2,y = GetDataset()
restresh = np.ones(shape=[11])
if dim == 0:
x = x1
else:
x = x2
if low_or_high == 'low':
restresh[x[:] <= threshnum]=-1
else:
restresh[x[:] > threshnum] = -1
return restresh

然后是对每次迭代中的阈值和结果进行迭代,这里对各维度和各阈值进行遍历,求出错误率最小的一组作为基学习器的结果,即树桩:

1
2
3
4
5
6
7
8
9
10
11
12
13
14
15
16
17
18
19
20
21
22
23
24
25
26
def GetStump(w):
minError = np.inf
best_val = np.ones(shape=[11])
x1,x2,y = GetDataset()
for i in range(2):
if i==0:
x = x1
else:
x = x2
rangeMin = x[:].min()
rangeMax = x[:].max()
stepSize = (rangeMax - rangeMin)/4.0
for j in range(4):
threshnum = rangeMin + stepSize*j
for item in ['low','high']:
resVal = BaseLearn(dim=i,threshnum=threshnum,low_or_high=item)
err = np.ones(shape=[11])
err[resVal == y] = 0
err_w = np.dot(w,err.T)
if err_w < minError:
minError = err_w
best_tresh = threshnum
best_item = item
best_dim = i
best_val = resVal.copy()
return best_val,minError,best_tresh,best_dim

然后进行基学习器的迭代,获得最终的学习器累加的结果:

1
2
3
4
5
6
7
8
9
10
11
12
13
14
15
16
17
18
19
20
21
22
23
24
25
26
def AdaBoost(iters):
w = np.ones(shape=[11])/11.0
x1,x2,y = GetDataset()
val_sum = np.zeros(shape=[11])


tresh_total_1 = []
tresh_total_2 = []
for i in range(iters):
val,error,tresh,dim = GetStump(w)
alpha = float(0.5*np.log((1-error)/max(error,1e-16)))
expon = -1*alpha*y*val
w_list = w*np.exp(expon)
w = w_list/w_list.sum()
val_sum += alpha*val
error_end = (np.sign(val_sum) != y).sum()/11
if error_end<0.2:
break
if dim == 0:
tresh_total_1.append(tresh)
if dim == 1:
tresh_total_2.append(tresh)

print(error_end)

return val_sum

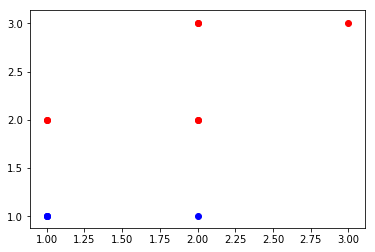
最后输出结果和分类的散点图,这里迭代四次,可以得到1,M对应的结果,如下:

1
2
3
4
5
6
7
8
9
10
11
val = AdaBoost(4)

for i in range(11):
if val[i] < 0:
plt.scatter(x1[i], x2[i], c='b')
else:
plt.scatter(x1[i], x2[i], c='r')

plt.show()

print(val[1],val[2])
0

output_16_1.png

(0.49041462650586315, 0.49041462650586315)

可以看出(1,M)对应的索引值均大于0,所以结果其分类结果为1。

0%