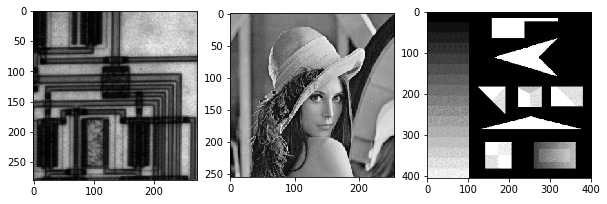
首先导入必备的库和图像,展示原始图像,如下所示:
1 | from PIL import Image |
1. Sobel算子
定义sobel算子的核,如下所示:
1 | def Sobel_Kernel(): |
然后定义卷积操作,如下所示:
1 | def process(img,kernel): |
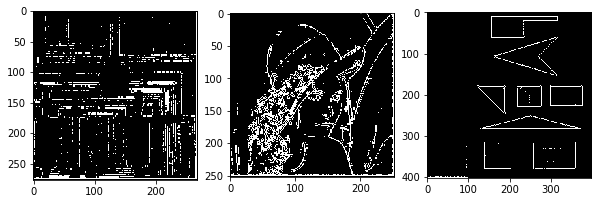
然后处理图像,如下所示,x方向,y方向,和综合的sobel边缘提取图如下所示,下面为sobel_x提取y方向的边缘,
1 | sobel,sobel_x,sobel_y = Sobel_Kernel() |
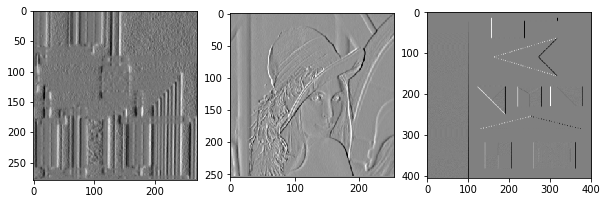
x方向边缘如下:
1 | image1_y = process(image_ori1,kernel=sobel_y) |
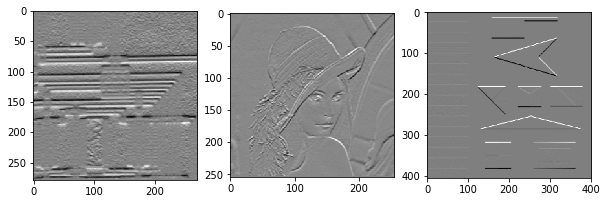
综合方向如下:
1 | image1_z = process(image_ori1,kernel=sobel) |
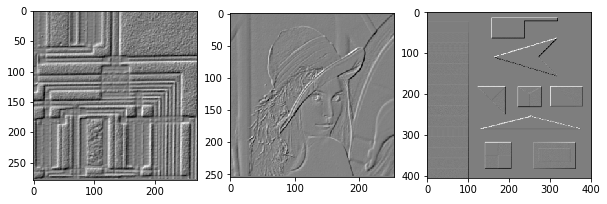
可以看出来效果还可以。
马尔算子
首先定义一个大小为5的高斯核,如下所示:
1 | def Gaussian_Kernel5(kernel_size=5, sigma=1.0): |
然后定义一个laplacian高斯核,如下所示:
1 | def Laplacian_Kernel(): |
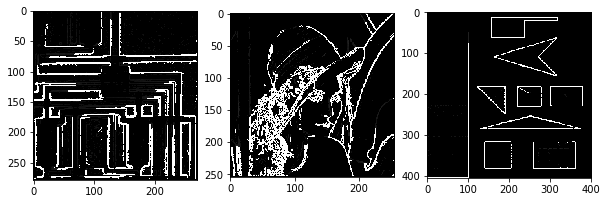
判断是否过0点的函数如下,注意很难找到一个正好二阶导为0的像素点,所以这里判断相邻两个像素的成绩是否小于一个足够大的负值,若满足条件,说明其是一个边缘点(梯度足够大且过0),则标记为白色点(255),否则为黑色。
1 | def If_Zero(img): |
然后是显示最后的图像结果,如下所示:
1 | kerner5_g = Gaussian_Kernel5() |
可以看出来检测出来的效果不咋地,可能是自己代码实现有问题QAQ。
Canny算子
首先定义一个大小为3的高斯卷积核,如下所示:
1 | def Gaussian_Kernel3(kernel_size=3, sigma=0.00001): |
然后是获得边缘梯度,这里直接使用PPT上获得边缘梯度的公式:
1 | def Get_Gradient(img): |
然后是进行非极大值抑制,这里对梯度方向两边的值和梯度值进行比较判断,如下所示:
1 | def Get_NMS(img_d,img_dx,img_dy): |
然后是进行连通性判断,看在阈值之间的区域的八邻域有没有值得连通的点:
1 | def Connect(img): |
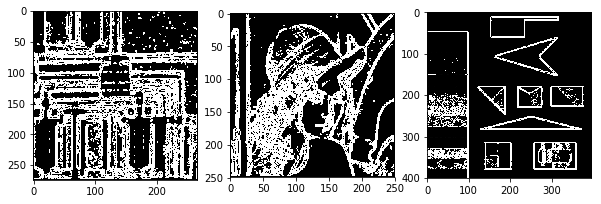
最后是获得边缘检测的结果,如下所示:
1 | kernel3_g = Gaussian_Kernel3() |
效果一般般,感觉勉强可以接受。
Susan算子
这个地方我都感觉没用到核的定义,直接对USAN区域进行判断就行了,遍历37个值,大于阈值则判定为边缘,如下所示:
1 | def Get_Susan(img): |
然后是使用Canny里面的NMS和连通性判断,获得最后边缘,结果如下:
1 | img1_d,img1_dx,img1_dy = Get_Gradient(Get_Susan(image_ori1)) |
emmm,感觉更差了,还不如canny,应该是代码有问题吧…….