python实现Harris检测

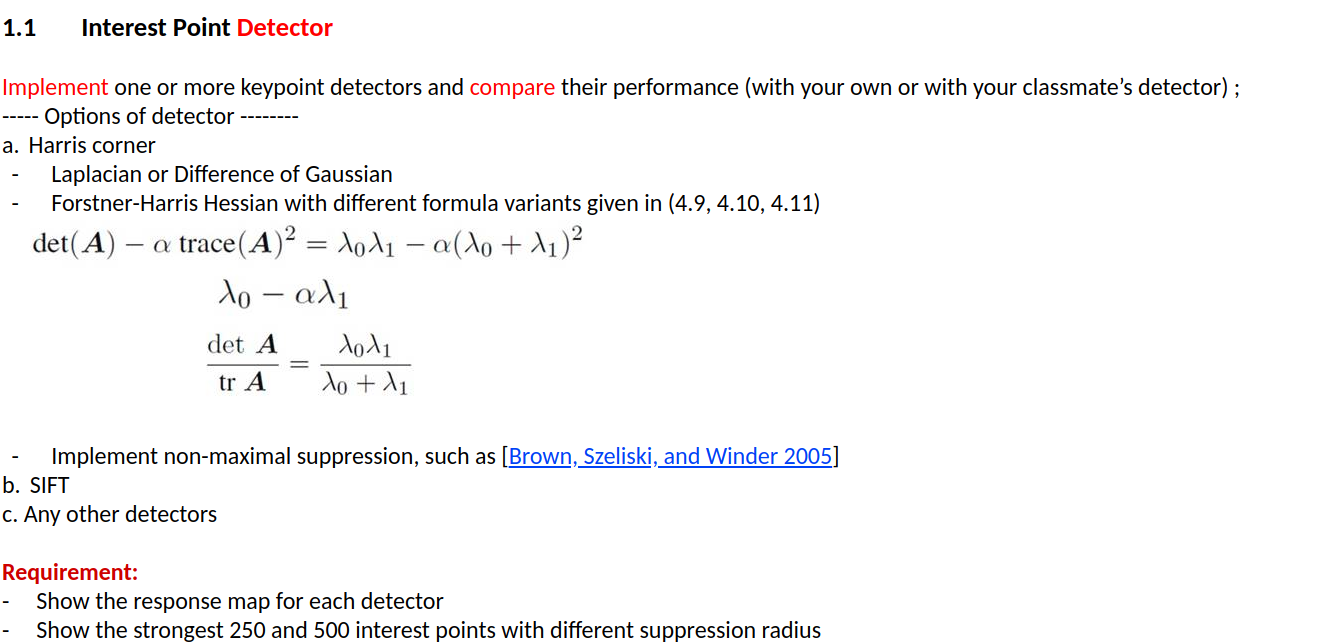
题目要求如下图所示:

2018-11-05 14-32-43屏幕截图.png

1
2
3
import matplotlib.pyplot as plt
from PIL import Image
import numpy as np

首先输入一张图,转换成灰度形式,代码如下:

1
2
3
4
5
6
image_input = Image.open('test.jpg')
image_ori = image_input.convert('L')
image_gray = np.array(image_ori)
plt.figure()
plt.imshow(image_gray,cmap=plt.cm.gray)
plt.show()

output_6_0.png

然后是梯度计算定义,如下所示:

1
2
3
4
5
6
7
def Convolution_gradient(image,kernel):
x_length,y_length = image.shape
image_res = np.zeros(shape=[image.shape[0],image.shape[1]])
for i in range(1,x_length-1):
for j in range(1,y_length-1):
image_res[i,j] = (image[i-1:i+2,j-1:j+2]*kernel).sum()
return image_res

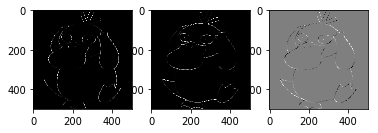
x,y方向上的算子,以及灰度图的在x方向和y方向上的计算如下所示:

1
2
3
4
5
6
7
8
9
10
11
12
13
14
15
16
17
18
19
20
edge_x = [[-1,0,1],
[-1,0,1],
[-1,0,1]]
edge_y = [[1,1,1],
[0,0,0],
[-1,-1,-1]]
image_dx = Convolution_gradient(image_gray,edge_x)
image_dy = Convolution_gradient(image_gray,edge_y)
image_dx2 =image_dx**2
image_dy2 = image_dy**2
image_dxdy = image_dx*image_dy

plt.figure()
plt.subplot(1,3,1)
plt.imshow(image_dx2,cmap=plt.cm.gray)
plt.subplot(1,3,2)
plt.imshow(image_dy2,cmap=plt.cm.gray)
plt.subplot(1,3,3)
plt.imshow(image_dxdy,cmap=plt.cm.gray)
plt.show()

output_10_0.png

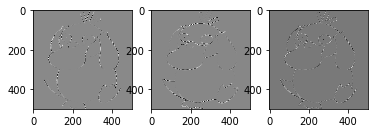
然后是构建LOG算子,并对图像做LOG处理,如下所示:

1
2
3
4
5
6
7
8
9
10
11
12
13
14
15
16
17
18
19
20
21
22
23
24
25
edge_LOG=[[0,0,1,0,0],
[0,1,2,1,0],
[1,2,-16,2,1],
[0,1,2,1,0],
[0,0,1,0,0]]

def Convolution_LOG(image,kernel):
x_length,y_length = image.shape
image_res = np.zeros(shape=[image.shape[0],image.shape[1]])
for i in range(2,x_length-2):
for j in range(2,y_length-2):
image_res[i,j] = (image[i-2:i+3,j-2:j+3]*kernel).sum()
return image_res

image_xx = Convolution_LOG(image_dx2,edge_LOG)
image_yy = Convolution_LOG(image_dy2,edge_LOG)
image_xy = Convolution_LOG(image_dxdy,edge_LOG)
plt.figure()
plt.subplot(1,3,1)
plt.imshow(image_xx,cmap=plt.cm.gray)
plt.subplot(1,3,2)
plt.imshow(image_yy,cmap=plt.cm.gray)
plt.subplot(1,3,3)
plt.imshow(image_xy,cmap=plt.cm.gray)
plt.show()

output_12_0.png

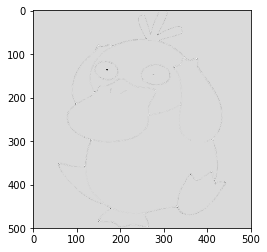
然后是构建M相关矩阵,并计算角点响应函数,如下所示:

1
2
3
4
5
6
7
8
9
10
11
12
13
def compute_Harris(image_xx,image_yy,image_xy):
Res = np.zeros(shape=[image_xx.shape[0],image_xx.shape[1]])
k = 0.04
x_dim,y_dim = image_xx.shape
for i in range(x_dim):
for j in range(y_dim):
Res[i,j] = (image_xx[i,j]*image_yy[i,j]-image_xy[i,j]**2)-k*((image_xx[i,j]+image_yy[i,j])**2)
return Res

Harris_ori = compute_Harris(image_xx,image_yy,image_xy)
plt.figure()
plt.imshow(Harris_ori,cmap=plt.cm.gray)
plt.show()

output_14_0.png

然后进行非极大值抑制,阈值设为0.03,输出角点数为204,如下所示:

1
2
3
4
5
6
7
8
9
10
11
12
13
14
15
16
17
T =0.03*np.max(Harris_ori)
def decide_Harris(Harris_ori,T):
index = 0
x_dim,y_dim = Harris_ori.shape
Harris_final = np.zeros(shape=[Harris_ori.shape[0],Harris_ori.shape[1]])
Harris_tmp = Harris_ori.copy()
for i in range(2,x_dim-1):
for j in range(2,y_dim-1):
tmp = Harris_tmp[i-1:i+2,j-1:j+2]
tmp[1,1]=0
if Harris_ori[i,j]>T and Harris_ori[i,j]>np.max(tmp) :
index+=1
Harris_final[i,j] = 1
return Harris_final,index

Harris_final,index = decide_Harris(Harris_ori,T)
print(index)
204

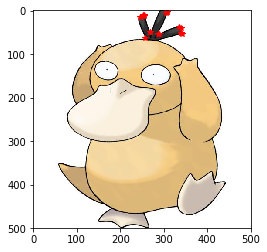
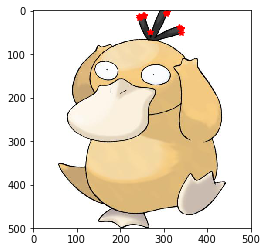
最后找到极大值所对应的坐标值,并标出在图像中的位置:

1
2
3
4
5
6
7
8
Harris_location = np.where(Harris_final)
Harris_location = np.array(Harris_location)
Harris_location = Harris_location.transpose(1,0)
plt.figure()
plt.imshow(image_input)
for i in range(18):
plt.plot(Harris_location[i,1],Harris_location[i,0],'r*')
plt.show()

output_18_0.png

阈值设为0.01时,输出角点数为278(这是本人的最大角点数),如下所示:

1
2
3
4
5
6
7
8
9
10
11
12
13
14
15
16
17
T =0.01*np.max(Harris_ori)
def decide_Harris(Harris_ori,T):
index = 0
x_dim,y_dim = Harris_ori.shape
Harris_final = np.zeros(shape=[Harris_ori.shape[0],Harris_ori.shape[1]])
Harris_tmp = Harris_ori.copy()
for i in range(2,x_dim-1):
for j in range(2,y_dim-1):
tmp = Harris_tmp[i-1:i+2,j-1:j+2]
tmp[1,1]=0
if Harris_ori[i,j]>T and Harris_ori[i,j]>np.max(tmp) :
index+=1
Harris_final[i,j] = 1
return Harris_final,index

Harris_final,index = decide_Harris(Harris_ori,T)
print(index)
278

对应的图如下:

1
2
3
4
5
6
7
8
Harris_location = np.where(Harris_final)
Harris_location = np.array(Harris_location)
Harris_location = Harris_location.transpose(1,0)
plt.figure()
plt.imshow(image_input)
for i in range(18):
plt.plot(Harris_location[i,1],Harris_location[i,0],'r*')
plt.show()

output_22_0.png

将上述两张图和姚明德同学的Harris算子在此图上的结果进行对比(阈值0.1),他的结果如下图所示:
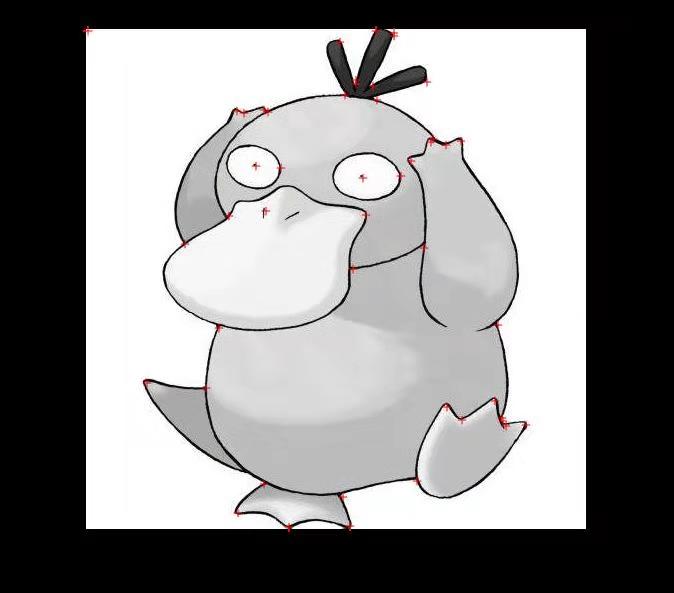
webwxgetmsgimg.jpeg

结论,可见与他的harris算子相比,其检测更为全面彻底,将整张图中的角点基本都标出来了,而我的harris检测算子只能检测很小的突出部分,这反映我的算法设计有严重缺陷,稳定性和敏感程度都有严重的问题,需要进行改进。

0%