1.1. iris数据集分类
1.1.1.数据集描述
简介:Iris也称鸢尾花卉数据集,是一类多重变量分析的数据集。
数据集大小:数据集包含150个花的数据。
样本类别数:3类。即Iris Setosa(山鸢尾)、Iris Versicolour(杂色鸢尾),以及Iris Virginica(维吉尼亚鸢尾)。
样本空间维度与样本分布:每类包括四个属性,即花萼长度,花萼宽度,花瓣长度,花瓣宽度。通过这四个属性预测样本属于哪一个类。
1.1.2. 分类器的描述
A. 使用SVM进行分类:
目标函数:max$\frac{1}{||w||}$,s.t.$y_i(w^Tx_i+b)>=1$,即最大化支持向量的间隔。
使用的工具包:sklearn机器学习库。
超参数及意义:主要超参数有,SVM的kernel核的种类,这里反映的是SVM如何将低维数据映射到高维空间的,对应的是$x_i$对应的核函数。这里我们选用的是线性核,其超参数C表示正则化系数。rbf核,其除了超参数C还有径向基大小gamma。以及多项式核,包括C和多项式系数degeree。
B.使用logistic分类器进行分类:
目标函数:最大化似然函数,即max$\Sigma (y_ilog(h(x_i))+(1-y_i)log(1-h(x_i)))$,其中$h(x)=\frac{1}{1+e^{w*x}}$
使用的工具包:sklearn工具包。
超参数及意义:C,即正则化的系数的倒数。
C.使用神经网络进行分类:
目标函数:softmax函数,即$argmax_{i}$$ pre_i = \frac{e^{wx_i}}{\Sigma e^{wx_i}}$
使用的工具包:sklearn工具包
超参数及意义:隐层神经元个数,这里设置隐层为两层。
1.1.3 实验条件
交叉验证:选择百分之70的数据用于训练,百分之30的数据用于测试,随机测5次取平均值。
模型选择:对于SVM选择线性核、RBF核和多项式核进行实验。对于logistic分类器选择不同的正则化系数进行对比。对于神经网络选用不同中间层参数进行对比。
评估参数:分类的正确数据占总数据的比例,即准确率。
1.1.4 实验结果分析
A. SVM结果分析(下面实验里都控制正则化系数的倒数C=1,超参数为不同的核,补充的超参数为rbf核的gamma值)
使用线性核分类的结果如下,第一行为训练准确率,第二行为训练准确率平均值,第三行为测试准确率,第四行为测试准确率平均值,代码见附录(下同)。
(‘training score:’, [0.9714285714285714, 0.9904761904761905, 0.9809523809523809, 0.9904761904761905, 0.9904761904761905])
(‘mean training score:’, 0.9847619047619048)
(‘test score:’, [0.9777777777777777, 1.0, 0.9555555555555556, 0.9777777777777777, 1.0])
(‘mean test score:’, 0.9822222222222223)
使用gamma值为0.7的rbf核进行分类,结果如下:
(‘training score:’, [0.9714285714285714, 0.9809523809523809, 1.0, 0.9904761904761905, 1.0])
(‘mean training score:’, 0.9885714285714287)
(‘test score:’, [0.9777777777777777, 0.9777777777777777, 0.9333333333333333, 0.9777777777777777, 0.9555555555555556])
(‘mean test score:’, 0.9644444444444444)
使用多项式系数为3的多项式核进行分类,结果如下:
(‘training score:’, [1.0, 0.9809523809523809, 0.9809523809523809, 0.9904761904761905, 0.9809523809523809])
(‘mean training score:’, 0.9866666666666667)
(‘test score:’, [0.9777777777777777, 1.0, 0.9777777777777777, 0.9777777777777777, 1.0])
(‘mean test score:’, 0.9866666666666667)
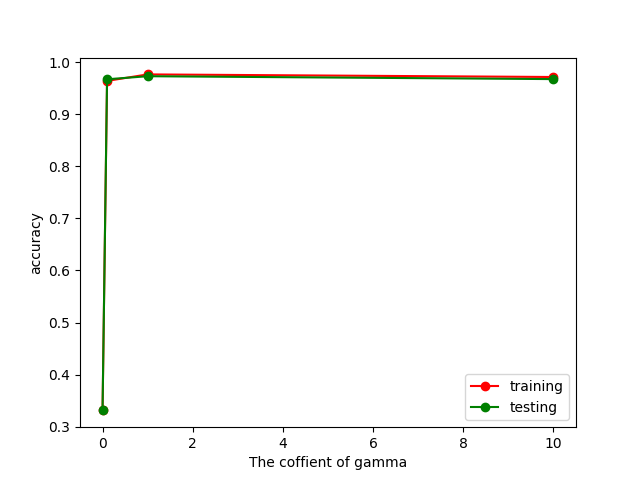
结论:可以看出使用三种核函数得出得出结果比较接近,rbf核的测试集准确率略低,可能和其核函数较为复杂,带来少量的过拟合有关系,总体来看基本没有过拟合或者欠拟合。分类效果评价:线性核=多项式3次核》rbf核。由于rbf核可能存在过拟合,这里补充了一个rbf核大小的影响,如下图所示:
1 | from sklearn import datasets |
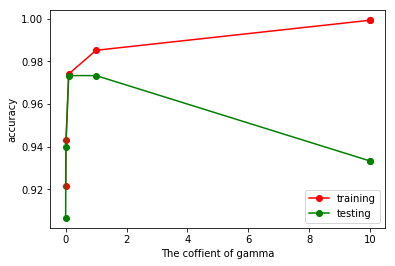
可以看出gamma值较大时,rbf核容易出现过拟合,验证了上面的想法。
B. logistic回归结果分析(超参数C为正则化系数的倒数,值越小表示正则化系数越大)
使用正则化系数为1进行分类,结果如下(代码见附录):
(‘training score:’, [0.9714285714285714, 0.9333333333333333, 0.9523809523809523, 0.9619047619047619, 0.9619047619047619])
(‘mean training score:’, 0.9561904761904761)
(‘test score:’, [0.9333333333333333, 0.9555555555555556, 0.9777777777777777, 0.8666666666666667, 0.9333333333333333])
(‘mean test score:’, 0.9333333333333333)
使用正则化系数为1000进行分类,结果如下:
(‘training score:’, [0.9714285714285714, 0.9714285714285714, 0.9714285714285714, 0.9714285714285714, 0.9809523809523809])
(‘mean training score:’, 0.9733333333333333)
(‘test score:’, [1.0, 0.9777777777777777, 0.9777777777777777, 0.9555555555555556, 0.9777777777777777])
(‘mean test score:’, 0.9777777777777779)
使用正则化系数为0.001进行分类,结果如下:
(‘training score:’, [0.6571428571428571, 0.6857142857142857, 0.6571428571428571, 0.6761904761904762, 0.6857142857142857])
(‘mean training score:’, 0.6723809523809525)
(‘test score:’, [0.6888888888888889, 0.6222222222222222, 0.6888888888888889, 0.6444444444444445, 0.6222222222222222])
(‘mean test score:’, 0.6533333333333333)
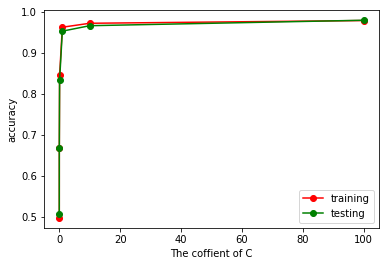
结论:logistic回归不能施加大的正则化系数,否则会对结果产生较差的影响产生欠拟合,该分类器不容易产生过拟合。因此对于超参数正则化项,这里C=0.001时为欠拟合,C=1时略有欠拟合,C=1000时基本没有欠拟合也没有过拟合。效果评价,C=1000好于C=1好于C=0.001。下面补充一张图,可以看出C越大,训练效果和测试效果越好。
1 | from sklearn import datasets |
C.神经网络结果分析(超参数为隐层神经元个数,隐层为两层,alpha=10)
使用隐层神经元数目为2进行分类,结果如下:
(‘training score:’, [0.9809523809523809, 0.9714285714285714, 0.34285714285714286, 0.3619047619047619, 0.9714285714285714])
(‘mean training score:’, 0.7257142857142858)
(‘test score:’, [0.9333333333333333, 0.9555555555555556, 0.3111111111111111, 0.26666666666666666, 0.9555555555555556])
(‘mean test score:’, 0.6844444444444445)
使用隐层神经元数目为4进行分类,结果如下:
(‘training score:’, [0.9809523809523809, 0.9619047619047619, 0.9714285714285714, 0.3523809523809524, 0.9809523809523809])
(‘mean training score:’, 0.8495238095238096)
(‘test score:’, [0.9555555555555556, 0.9777777777777777, 0.9555555555555556, 0.28888888888888886, 0.9555555555555556])
(‘mean test score:’, 0.8266666666666665)
使用隐层神经元数目为8进行分类,结果如下:
(‘training score:’, [0.9809523809523809, 0.9714285714285714, 0.9714285714285714, 0.9523809523809523, 0.9714285714285714])
(‘mean training score:’, 0.9695238095238095)
(‘test score:’, [0.9333333333333333, 0.9555555555555556, 0.9333333333333333, 0.9555555555555556, 0.9777777777777777])
(‘mean test score:’, 0.9511111111111111)
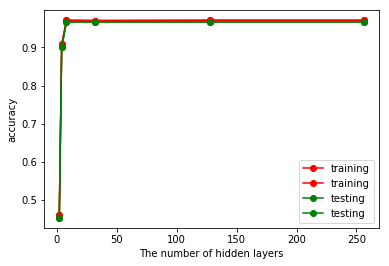
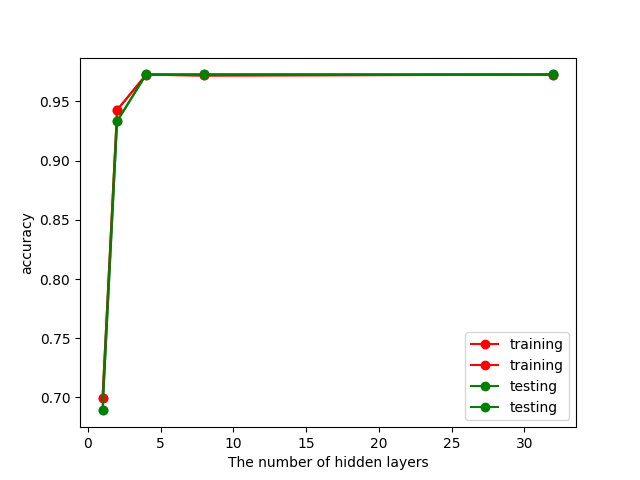
结论:隐层神经元的提高有利于防止欠拟合,且具有较好的效果。补充,隐层神经元数目对于结果的影响,如下所示,可验证本人猜想:
1 | from sklearn import datasets |
综合评价:通过比较各个分类器中最好的那个超参数所具备的分类器,我们可以得到在iris数据集上各个分类器的排名是:多项式系数为3的SVM多项式核分类器>C为1000的logistic分类器>隐层神经元数目为8的神经网络。
1.2 wine数据集分类
1.2.1 数据集描述
简介:啤酒数据集,也是一种多重变量数据集。
数据集大小:包不同起源的葡萄酒的共178条记录。
样本类别:共3类。
样本空间维度与样本分布:共有13个属性即葡萄酒的13种化学成分。通过化学分析可以来推断葡萄酒的起源。所有属性变量都是连续变量。
1.2.2. 分类器描述(同1.1.2,这里不再赘述)
1.1.3 实验条件
交叉验证:同样这里选择百分之30的数据集进行测试,百分之70的数据集进行训练。
模型选择:因为属性众多,这里首先选择LDA进行降维成4类,后面选择与1.1.3相同。
评估参数:分类的正确数据占总数据的比例,即准确率。
1.1.4. 实验结果分析
A.SVM结果分析(下面实验里都控制正则化系数的倒数C=1,超参数为不同的核,补充的超参数为rbf核的gamma值)
使用线性核分类的结果如下,第一行为训练准确率,第二行为训练准确率平均值,第三行为测试准确率,第四行为测试准确率平均值,代码见附录(下同)。
(‘training score:’, [0.9758064516129032, 0.9596774193548387, 0.9838709677419355, 0.9758064516129032, 0.9758064516129032])
(‘mean training score:’, 0.9741935483870968)
(‘test score:’, [0.9629629629629629, 1.0, 0.9444444444444444, 0.9629629629629629, 0.9629629629629629])
(‘mean test score:’, 0.9666666666666666)
使用gamma值为0.7的rbf核进行分类,结果如下:
(‘training score:’, [0.9758064516129032, 0.9838709677419355, 0.9838709677419355, 0.967741935483871, 0.9919354838709677])
(‘mean training score:’, 0.9806451612903226)
(‘test score:’, [0.9629629629629629, 0.9444444444444444, 0.9629629629629629, 1.0, 0.9259259259259259])
(‘mean test score:’, 0.9592592592592591)
使用多项式系数为3的多项式核进行分类,结果如下:
(‘training score:’, [0.9596774193548387, 0.9596774193548387, 0.967741935483871, 0.9758064516129032, 0.967741935483871])
(‘mean training score:’, 0.9661290322580646)
(‘test score:’, [0.9629629629629629, 1.0, 0.9814814814814815, 0.9259259259259259, 0.9629629629629629])
(‘mean test score:’, 0.9666666666666666)
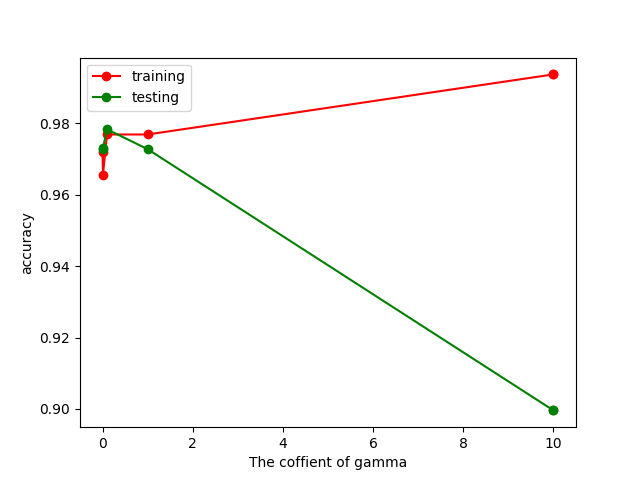
结论:这三种核的结果非常接近,基本没有过拟合或者欠拟合(可能rbf核有少量的过拟合),rbf核gamma大小对训练集和测试集影响图如下所示,可以看出gamma太大会导致过拟合。
B.logistic回归结果分析(超参数C为正则化系数的倒数,值越小表示正则化系数越大)
使用正则化系数C为1进行分类,结果如下:
(‘training score:’, [0.967741935483871, 0.9919354838709677, 1.0, 0.9758064516129032, 0.967741935483871])
(‘mean training score:’, 0.9806451612903226)
(‘test score:’, [1.0, 0.9259259259259259, 0.9074074074074074, 0.9629629629629629, 0.9629629629629629])
(‘mean test score:’, 0.951851851851852)
使用正则化系数为1000进行分类,结果如下:
(‘training score:’, [0.967741935483871, 0.9838709677419355, 0.9758064516129032, 0.967741935483871, 0.9758064516129032])
(‘mean training score:’, 0.9741935483870968)
(‘test score:’, [0.9814814814814815, 0.9629629629629629, 0.9444444444444444, 0.9814814814814815, 0.9629629629629629])
(‘mean test score:’, 0.9666666666666666)
使用正则化系数C为1e-18进行分类,结果如下:
(‘training score:’, [0.33064516129032256, 0.3548387096774194, 0.3225806451612903, 0.3225806451612903, 0.33064516129032256])
(‘mean training score:’, 0.332258064516129)
(‘test score:’, [0.3333333333333333, 0.2777777777777778, 0.35185185185185186, 0.35185185185185186, 0.3333333333333333])
(‘mean test score:’, 0.3296296296296296)
结论:logistic回归不能施加大的正则化系数,否则会对结果产生较差的影响产生欠拟合,该分类器不容易产生过拟合。因此对于超参数正则化项,这里C=1e-18时为欠拟合,C=1时略有欠拟合,C=1000时基本没有欠拟合也没有过拟合。有意思的是这里同第一个数据集相比,C=0.001时没有表现的非常差,可能是因为其原始数据集属性较多,即使降维后依然保证数据有较强的鲁棒性。C相关图如下,可验证结论:
C.神经网络结果分析(超参数为隐层神经元个数,隐层为两层,alpha=10)
使用隐层神经元数目为2进行分类,结果如下:
(‘training score:’, [0.9596774193548387, 0.967741935483871, 0.8629032258064516, 0.9032258064516129, 0.9112903225806451])
(‘mean training score:’, 0.920967741935484)
(‘test score:’, [0.9814814814814815, 0.9814814814814815, 0.6851851851851852, 0.8333333333333334, 0.9259259259259259])
(‘mean test score:’, 0.8814814814814815)
使用隐层神经元数目为4进行分类,结果如下:
(‘training score:’, [0.9758064516129032, 0.8951612903225806, 0.967741935483871, 0.9919354838709677, 0.967741935483871])
(‘mean training score:’, 0.9596774193548387)
(‘test score:’, [0.9629629629629629, 0.8703703703703703, 0.9814814814814815, 0.9444444444444444, 0.9814814814814815])
(‘mean test score:’, 0.9481481481481483)
使用隐层神经元数目为8进行分类,结果如下:
(‘training score:’, [0.9838709677419355, 0.967741935483871, 0.967741935483871, 0.967741935483871, 0.967741935483871])
(‘mean training score:’, 0.970967741935484)
(‘test score:’, [0.9444444444444444, 0.9814814814814815, 0.9814814814814815, 0.9814814814814815, 1.0])
(‘mean test score:’, 0.9777777777777779)
结论:隐层神经元的提高有利于防止欠拟合,且具有较好的效果。有意思的是相同神经元的条件下,神经网络在该数据集上的效果好于iris数据集,反映了前面所述该数据集复杂度更高的结论。正确率与神经元数目的关系如下图:
综合评价:通过比较各个分类器中最好的那个超参数所具备的分类器,我们可以得到在wine数据集上各个分类器的排名是:隐层神经元数目为8的神经网络>C为1000的logistic分类器=多项式核系数为3的SVM分类器。
综合评价
对比三个分类器在两个数据集上的表现,可以得到以下结论:
1.在iris数据集上SVM多项式核的效果最好,8个隐层的神经元MLP效果最差,在wine数据集上表现正好相反,我们知道MLP有强大的拟合能力,适用于较复杂的数据,这可能是因为wine数据集类别数较多,需要的模型更复杂所导致的。
2.同样由于wine数据集更复杂,需要更大的正则化系数才能降低准确率,体现了较强的鲁棒性。
3.综上,SVM在iris的表现好于wine,MLP在wine上的表现好于iris,logistic在wine上表现相对较好,鲁棒性更强。